plot_theme <- function(dark = FALSE) {
  bg <- if (dark) "#212529" else "#f8f9fa"
  fg <- if (dark) "#f8f9fa" else "#212529"

  theme(
    panel.background = element_rect(fill = bg, colour = NA),
    plot.background  = element_rect(fill = bg, colour = NA),
    legend.background = element_rect(fill = bg, colour = NA),
    legend.key = element_rect(fill = bg, colour = NA),
    text = element_text(color = fg),
    axis.text = element_text(color = fg),
    axis.line = element_line(color = fg),
    axis.ticks = element_line(color = fg)
  )
}

theme_set(theme_classic(base_size = 12) + plot_theme())개요
이전 글에서는 이미 저장된 그림을 Quarto layout 문법으로 재배치하는 방법을 소개했다.
이번에는 R 코드 청크에서 직접 렌더링되는 여러 그래프를 다룬다. layout-nrow로 패널을 배열하고, column 청크 옵션으로 해당 출력물만 본문 폭 바깥까지 넓힐 수 있다.
먼저 ggplot2 테마를 전역 설정한다.
비교를 위해 간단한 그래프 세 개를 만든다.
make_demo_plots <- function(dark = FALSE) {
point_color <- if (dark) "#7CC7F2" else "#56B4E9"
line_color <- if (dark) "#F2B84B" else "#E69F00"
list(
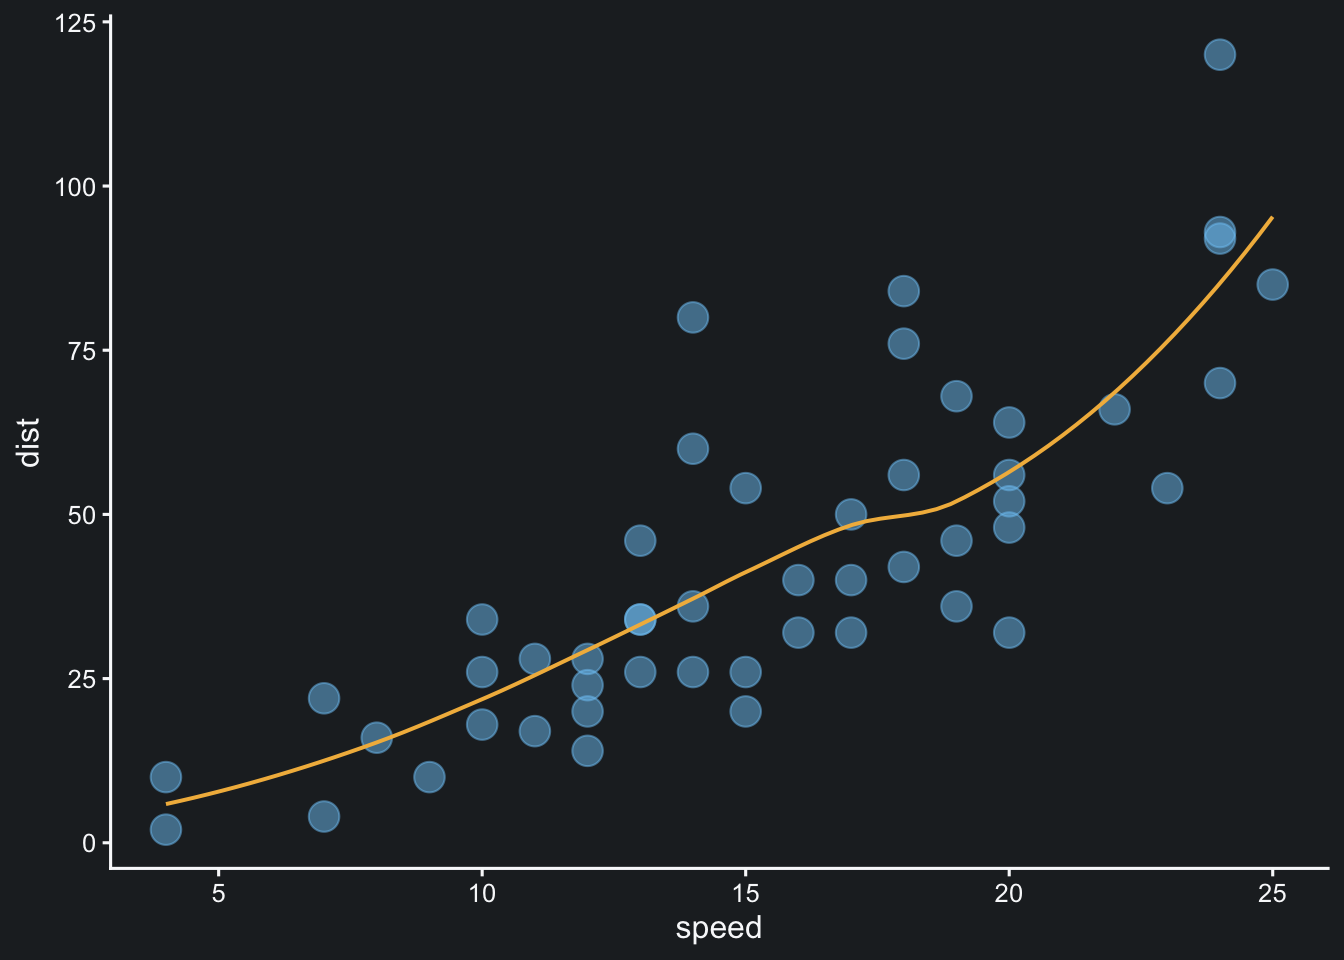
g1 = ggplot(data = cars, aes(x = speed, y = dist)) +
geom_point(size = 5, alpha = 0.5, color = point_color) +
geom_smooth(
method = "loess",
formula = y ~ x,
se = FALSE,
linewidth = 0.7,
color = line_color
) +
plot_theme(dark),
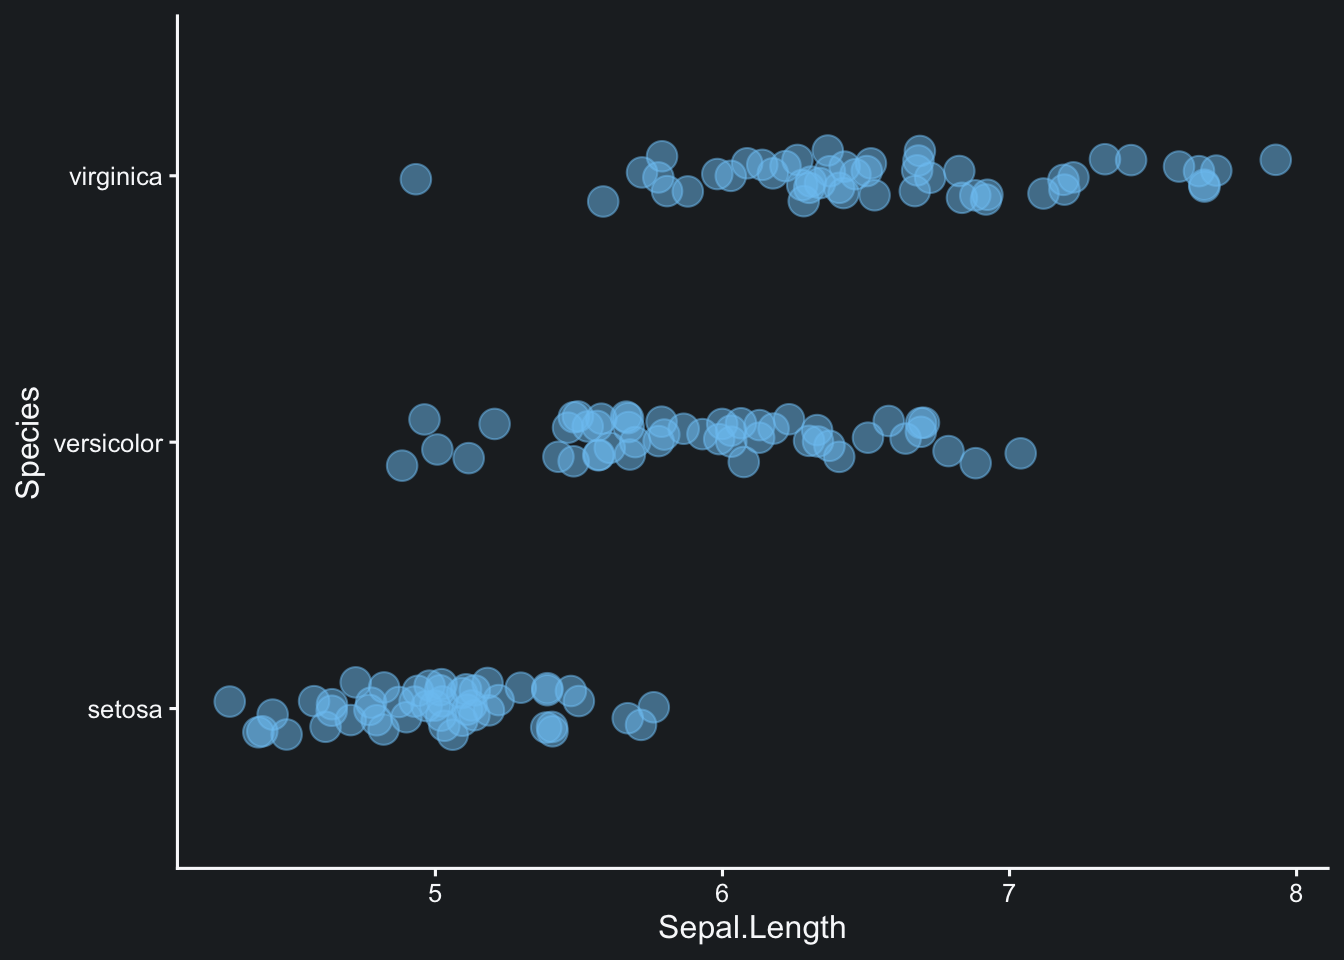
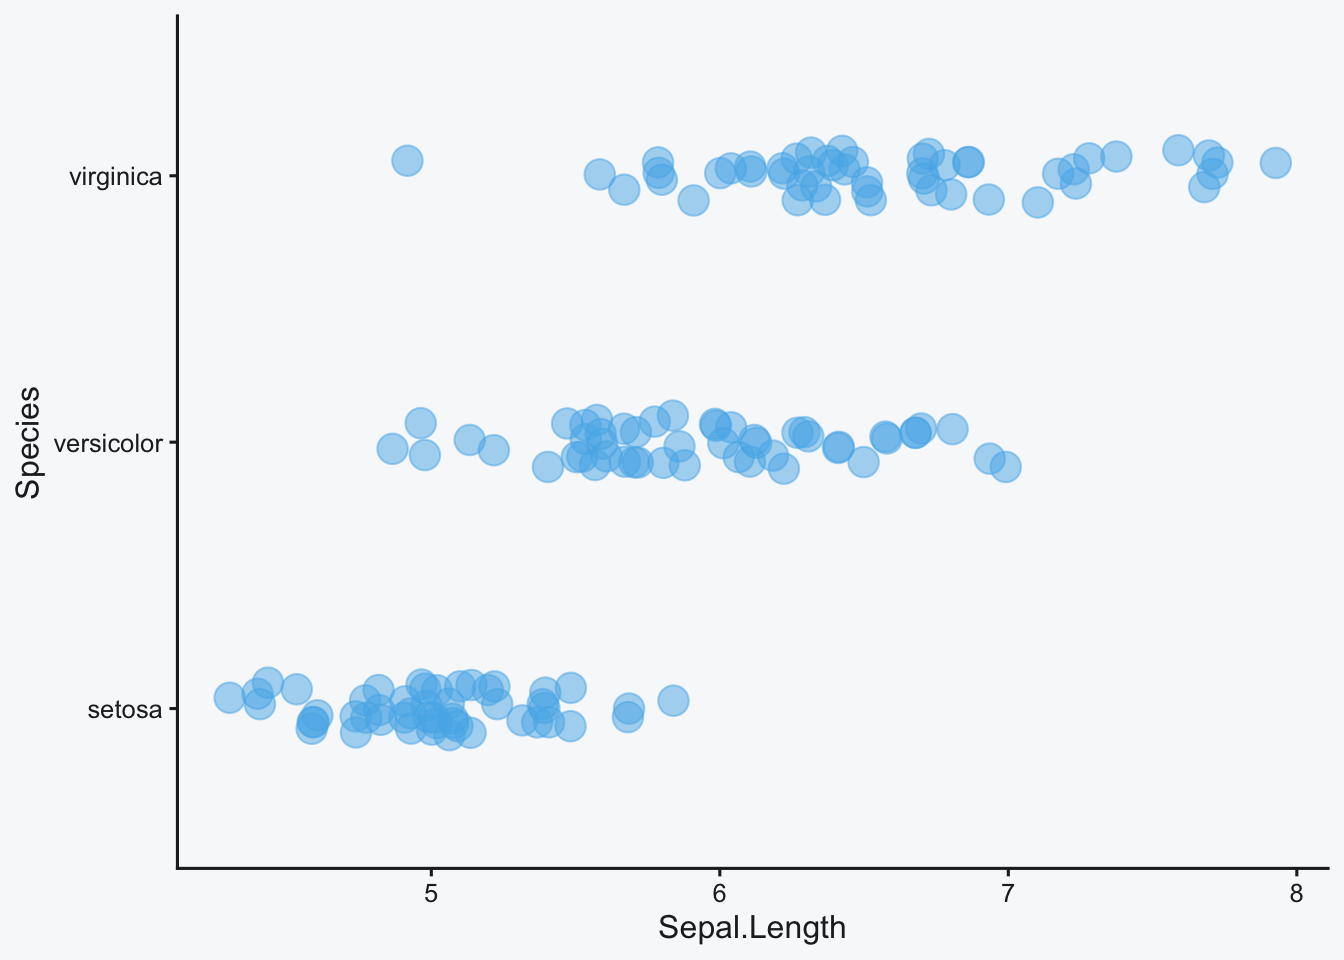
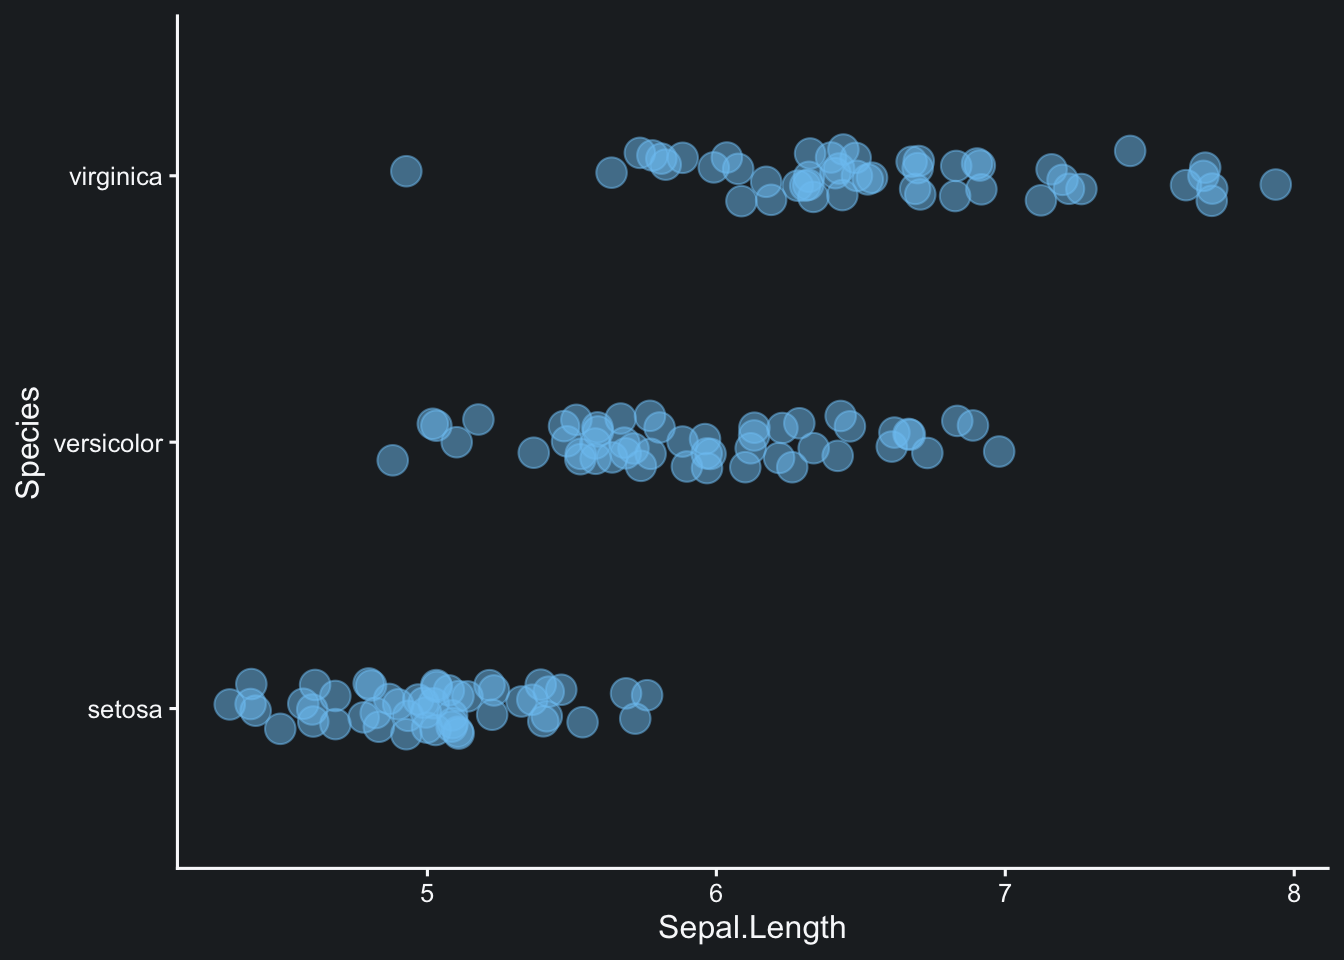
g2 = ggplot(data = iris, aes(x = Sepal.Length, y = Species)) +
geom_jitter(size = 5, alpha = 0.5, height = 0.1, color = point_color) +
plot_theme(dark),
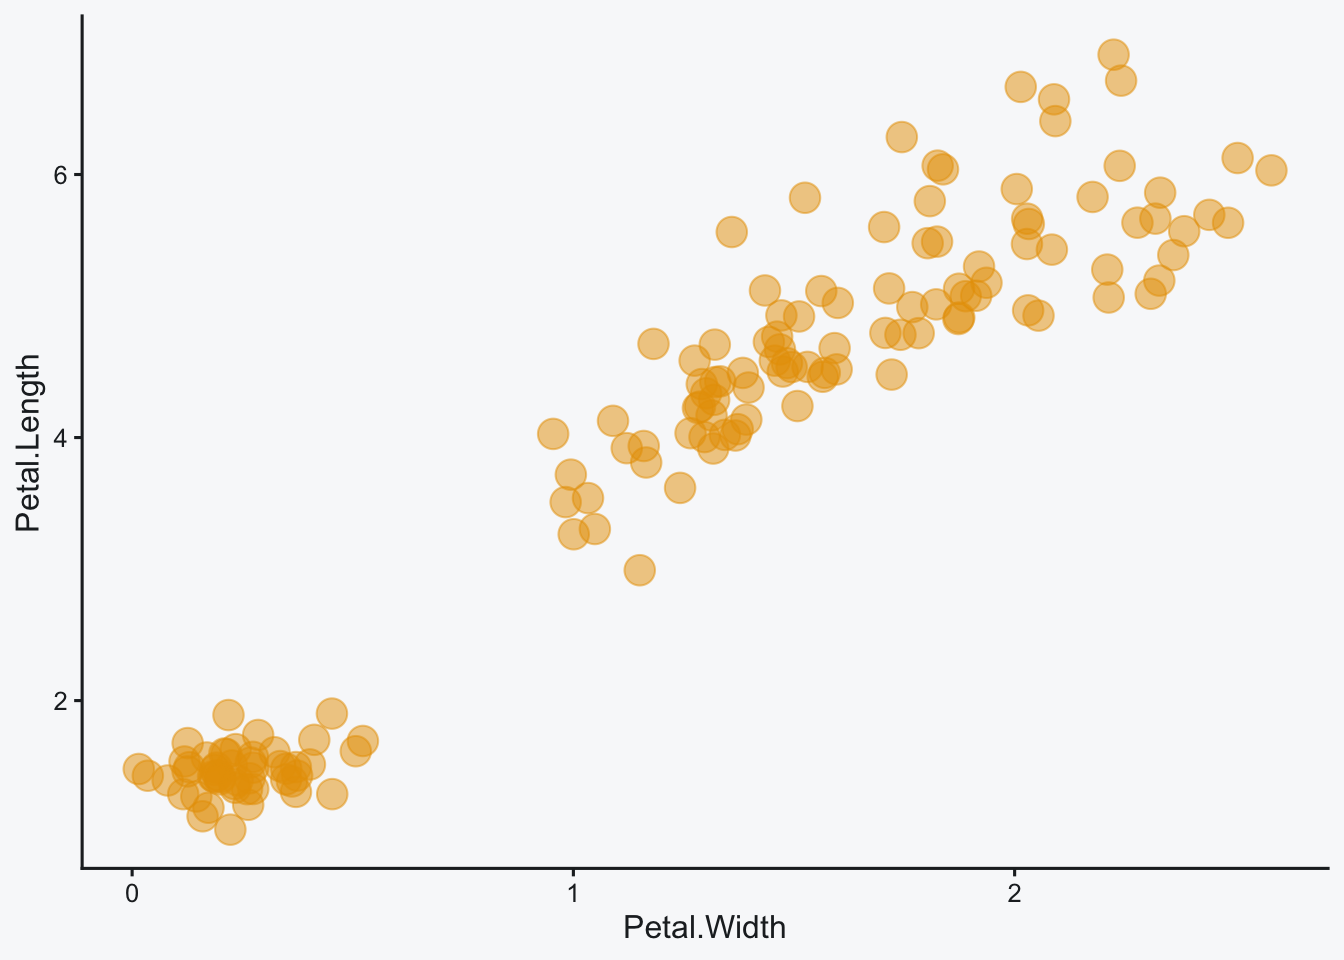
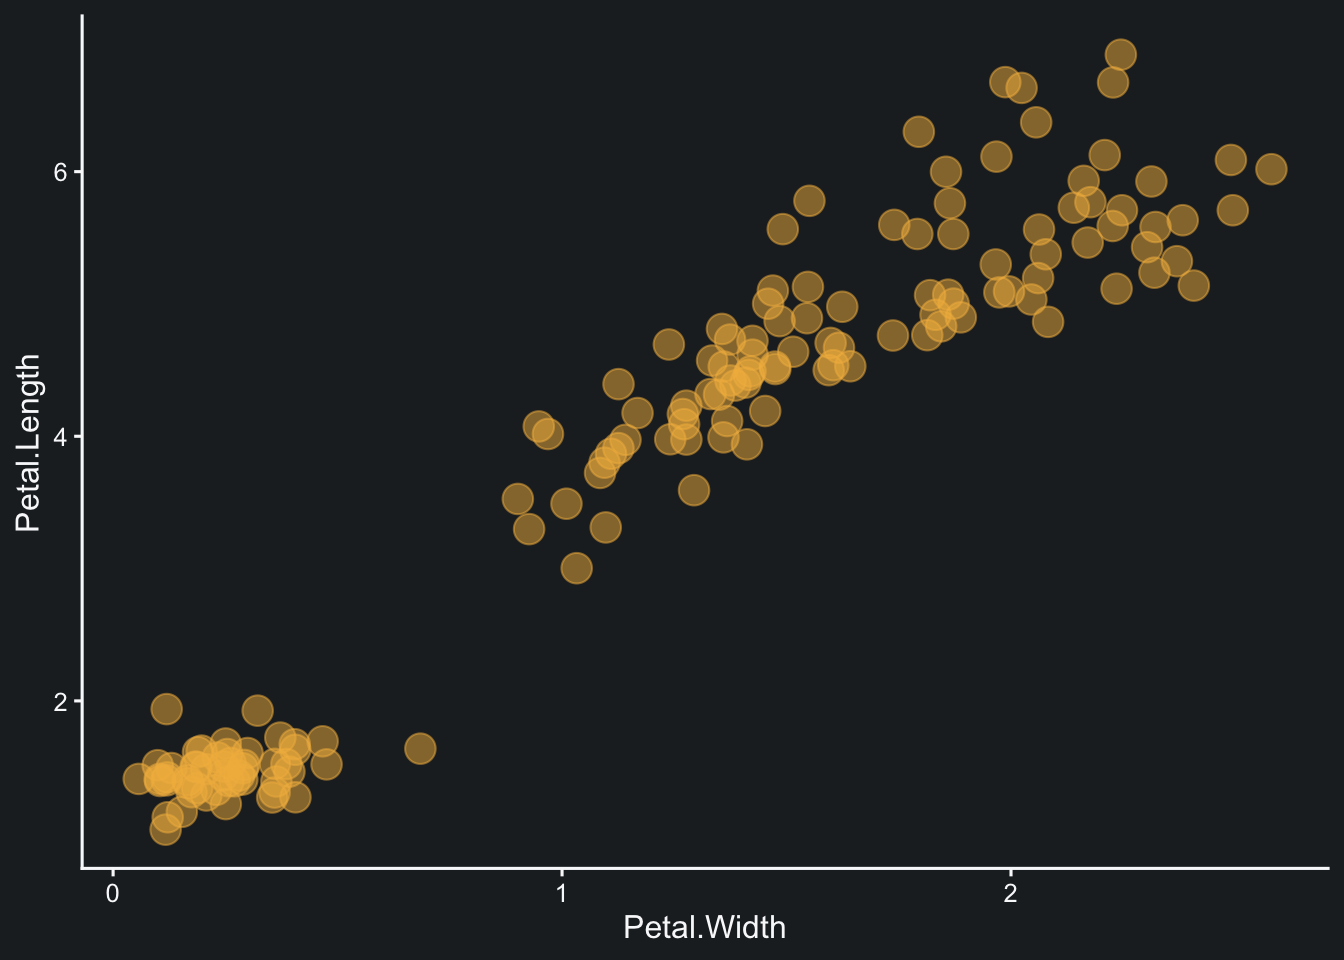
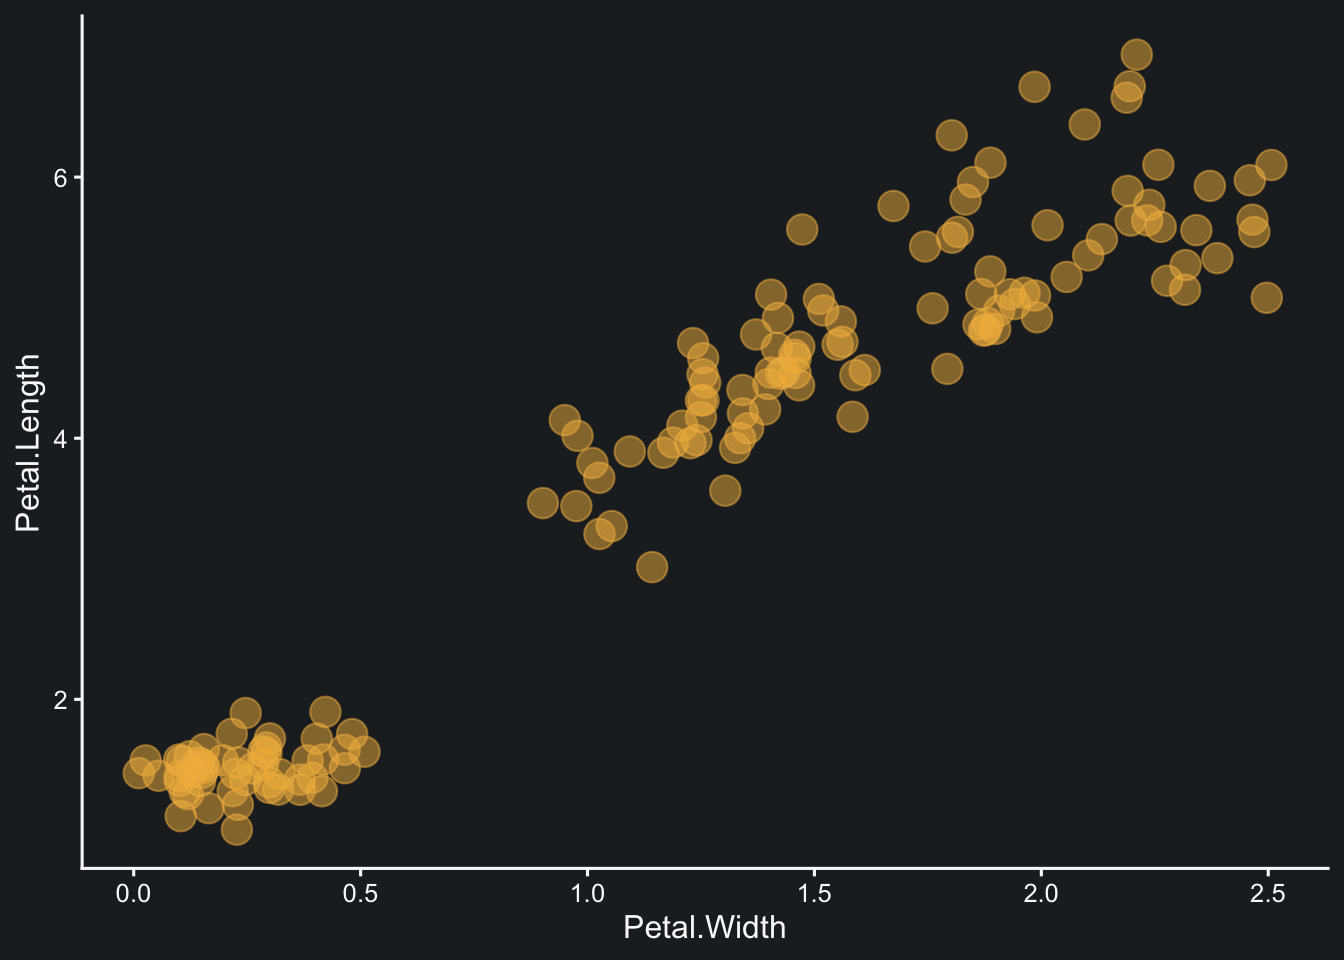
g3 = ggplot(data = iris, aes(x = Petal.Width, y = Petal.Length)) +
geom_jitter(size = 5, alpha = 0.5, width = 0.1, color = line_color) +
plot_theme(dark)
)
}
plots_light <- make_demo_plots()
plots_dark <- make_demo_plots(dark = TRUE)
g1 <- plots_light$g1
g2 <- plots_light$g2
g3 <- plots_light$g3본문 폭에서 여러 그림 넣기
layout-nrow: 1은 한 행에 여러 출력 그림을 배치한다. 먼저 그래프 두 개를 본문 폭 안에서 출력해보자.


```{r}
#| message: false
#| layout-nrow: 1
#| dev.args: { bg: "#212529" }
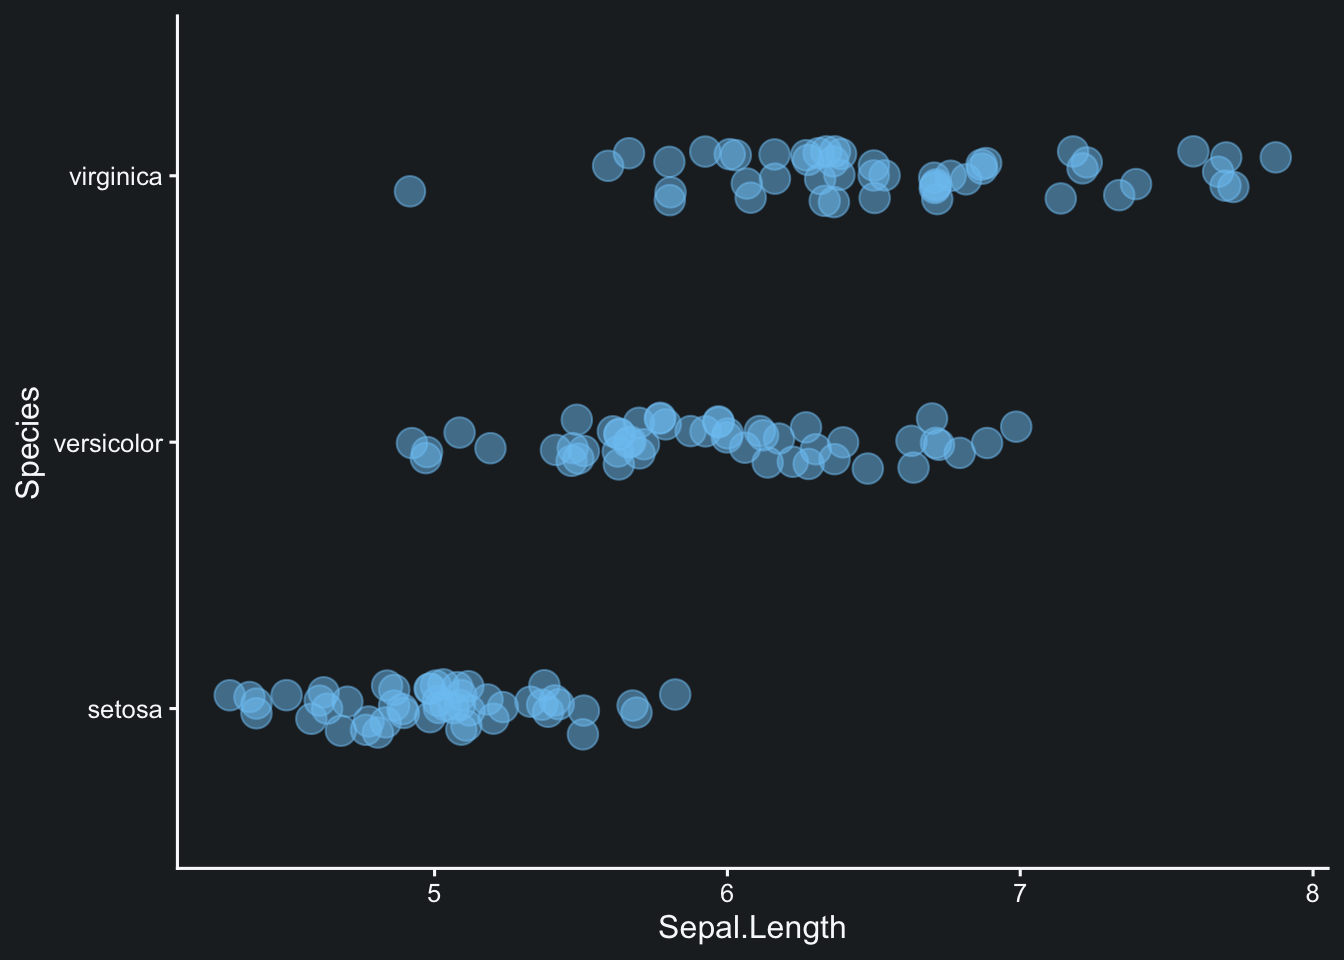
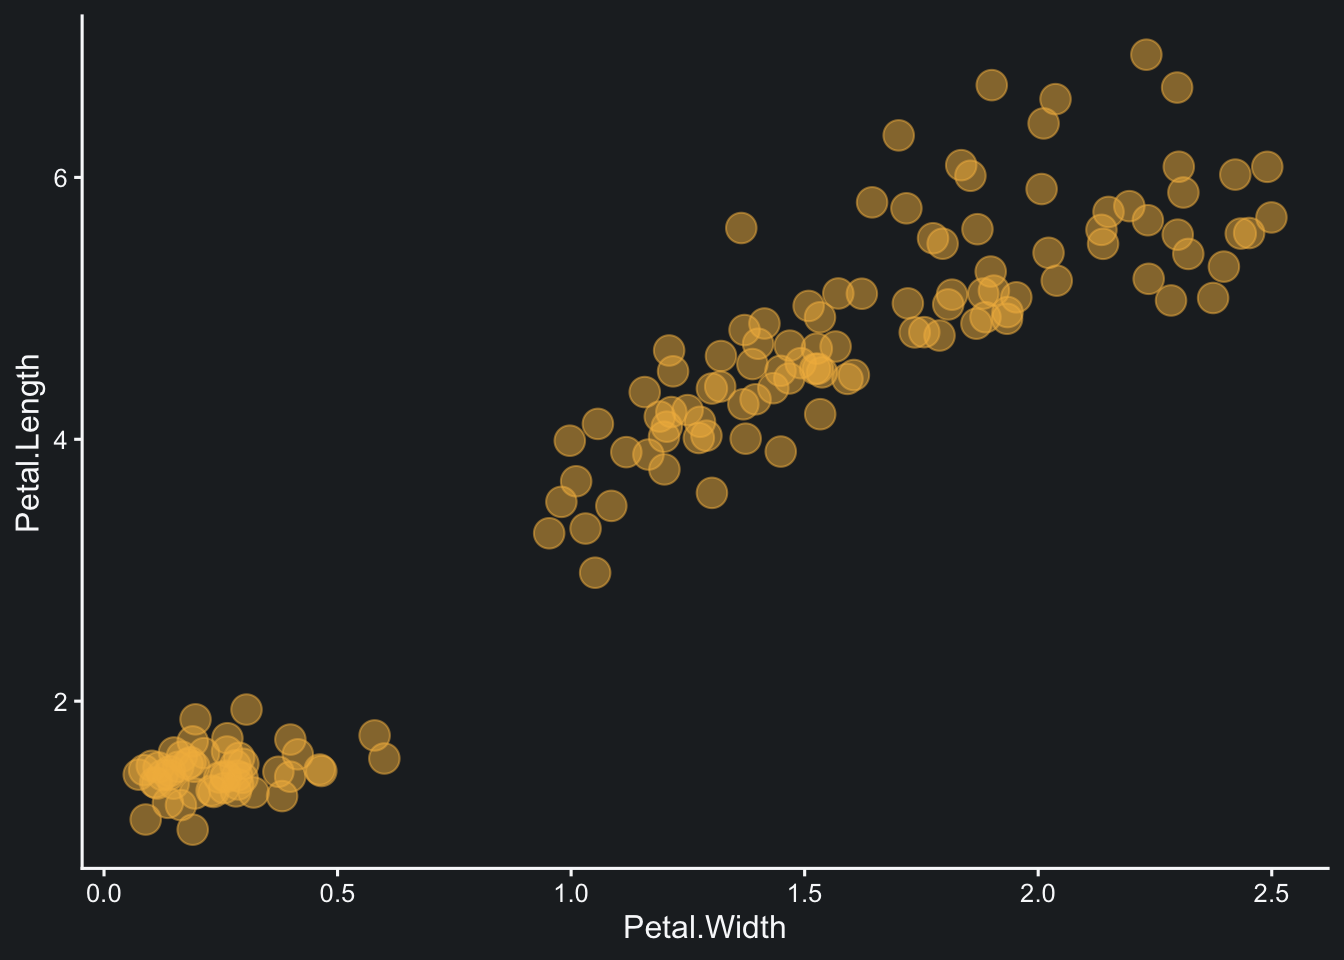
print(plots_dark$g1); print(plots_dark$g2)
```

본문 폭에 그림 세 개를 넣으면 축과 점의 간격이 좁아져 비교가 어려워진다.


column 옵션으로 출력 폭 넓히기
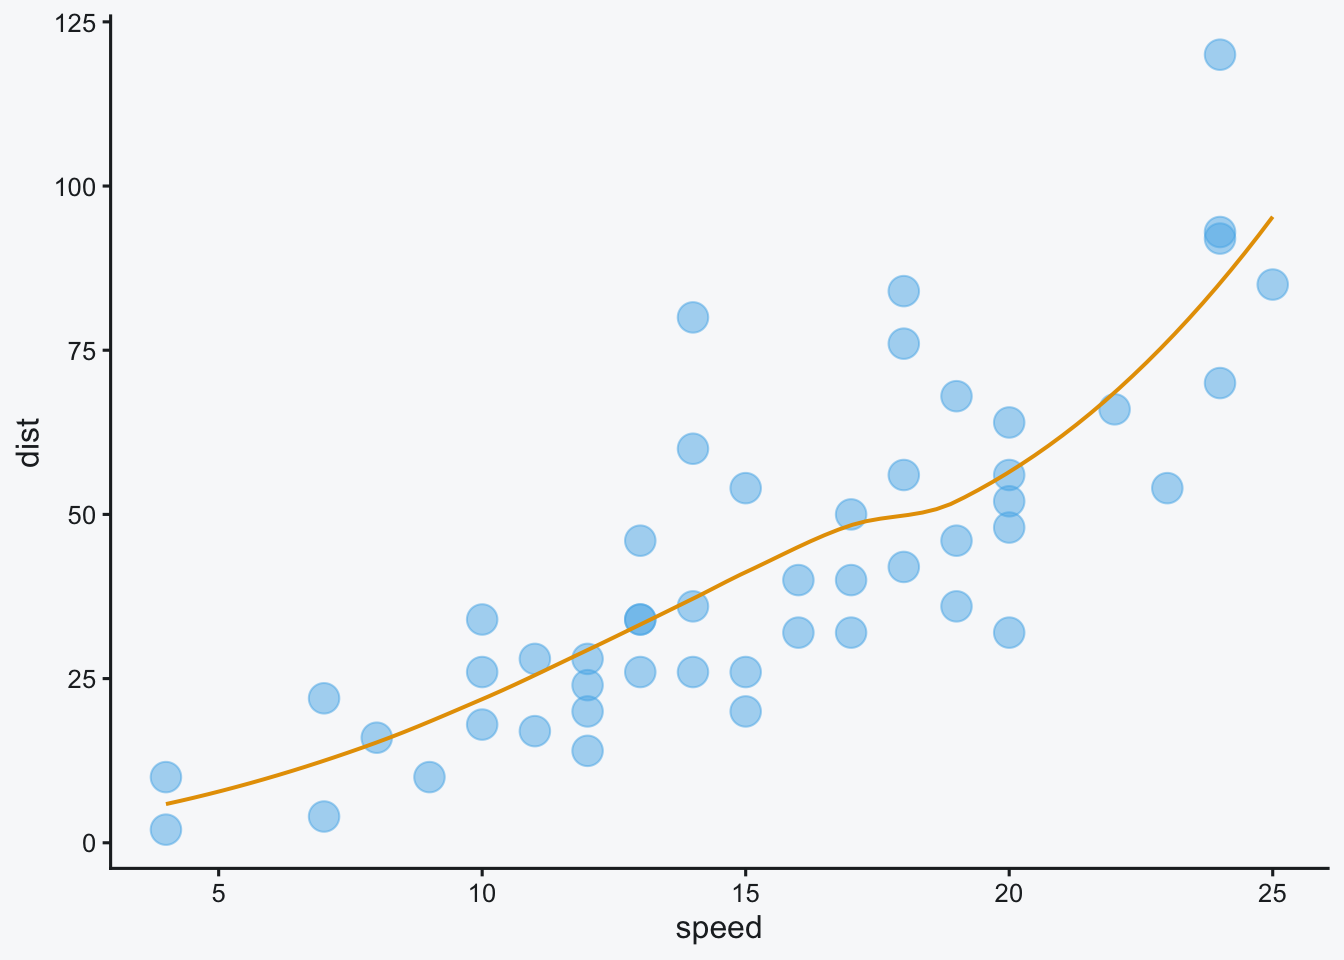
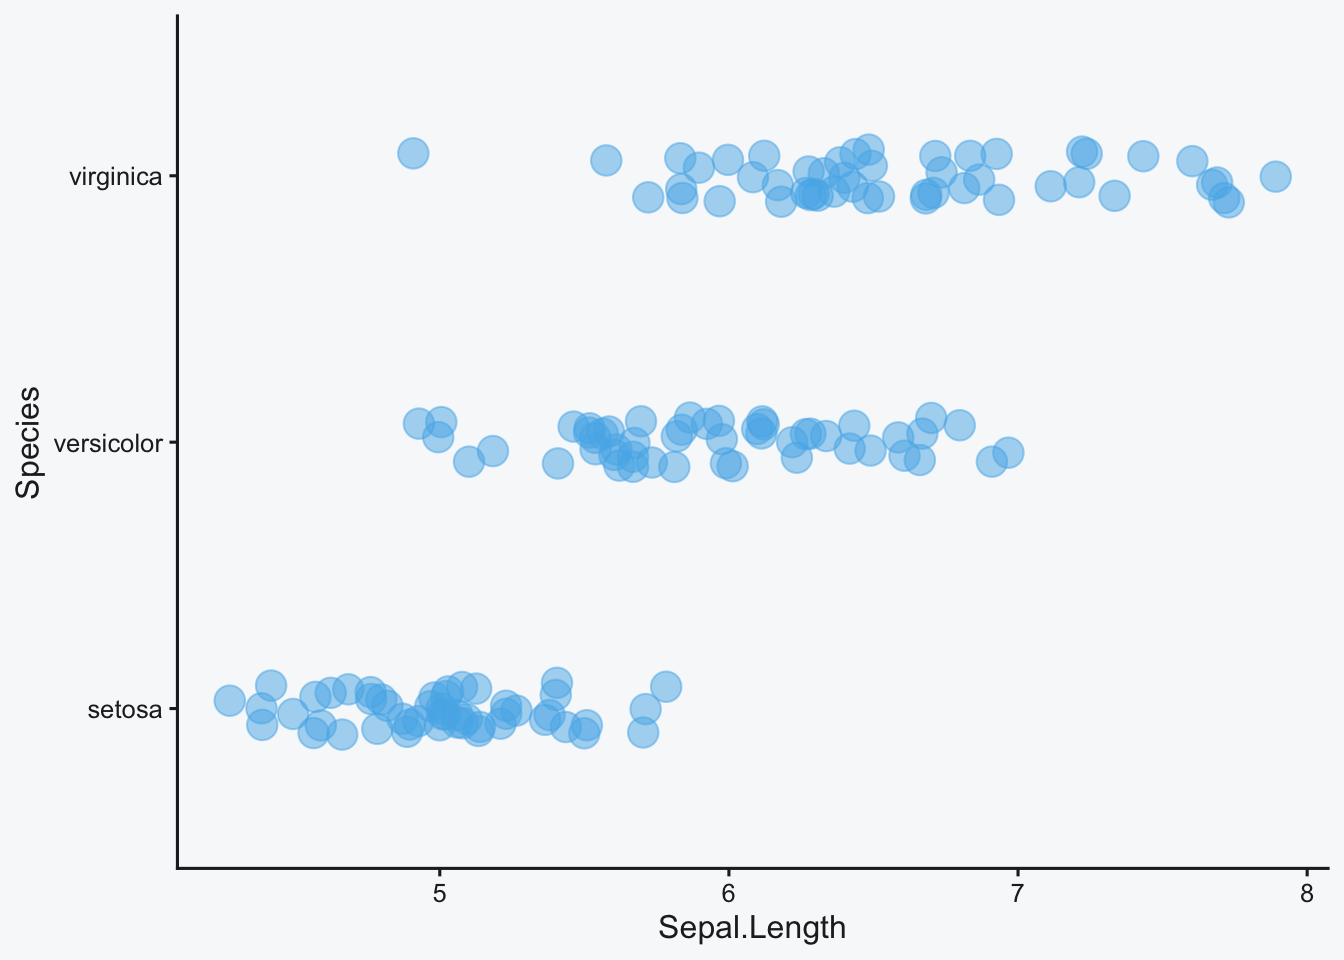
세 개의 패널을 한 줄에 유지하려면 코드 청크에 column: page를 지정할 수 있다. 본문 자체의 줄 길이는 유지하면서, 이 출력물만 페이지 폭까지 확장한다.
```{r}
#| message: false
#| layout-nrow: 1
#| column: page
#| dev.args: { bg: "#f8f9fa" }

print(g1); print(g2); print(g3)
```


```{r}
#| message: false
#| layout-nrow: 1
#| column: page
#| dev.args: { bg: "#212529" }

print(plots_dark$g1); print(plots_dark$g2); print(plots_dark$g3)
```
선택할 수 있는 폭은 다음과 같다.
column 값 |
출력 범위 | 적합한 상황 |
|---|---|---|
지정하지 않음 (body) |
본문 폭 | 그래프 한 개 또는 단순한 두 패널 |
page |
본문과 양쪽 여백을 포함한 폭 | 축·범례가 있는 세 패널 비교 |
screen-inset |
화면 폭에 가까운 넓은 영역 | 지도나 촘촘한 다중 패널 |
screen-inset-shaded |
넓은 영역과 배경 강조 | 본문 중 시선을 모아야 하는 핵심 결과 |
screen-inset은 페이지 폭보다 넓은 영역이 실제로 필요한 경우에 사용한다.
```{r}
#| message: false
#| layout-nrow: 1
#| column: screen-inset
#| dev.args: { bg: "#f8f9fa" }

print(g1); print(g2); print(g3)
```
```{r}
#| message: false
#| layout-nrow: 1
#| column: screen-inset
#| dev.args: { bg: "#212529" }

print(plots_dark$g1); print(plots_dark$g2); print(plots_dark$g3)
```
본문 흐름 속에서 넓은 그림을 구분하고 싶다면 screen-inset-shaded를 사용한다.


마무리
본문에서 설명을 바로 이어가는 그래프라면 먼저 column: page를 고려하는 편이 안정적이다. screen-inset 계열은 넓은 폭 자체가 해석에 도움이 될 때만 사용하는 것이 좋다. 그림이 네 개 이상이라면 무조건 폭을 넓히기보다 layout-ncol: 2로 행을 나누는 편이 모바일에서도 읽기 쉽다.